
MLS Eastern Conference Playoff Race 2026: NYCFC, NYRB, Orlando City, Toronto FC & DC United – Data Analysis
Five teams remain locked in a tight battle for the Eastern Conference playoffs. This MLS 2026 data analysis compares their expected points, attacking identities, build-up approaches and defensive intensity to assess which sides are best equipped to reach the post-season.

With the 2026 MLS regular season entering its decisive stages, the battle for the Eastern Conference playoffs is becoming increasingly difficult to separate.
While the teams at the top have already established a clear advantage, the race further down the standings remains wide open, with five sides currently separated by just three points from seventh to 11th.
In this MLS data analysis, we examine the teams fighting to secure their place in the post-season, looking beyond the league table to understand what is driving their respective campaigns.
We will assess their attacking and defensive performances, underlying numbers, and efficiency to determine which sides are best equipped to make the playoffs.
Expected Points Reveal A Race Built On Fine Margins
The expected points model suggests that all five playoff contenders have collected fewer points than their underlying performances would indicate, although the size of the gap varies considerably.
Actual Points Vs Expected Points In The Eastern Conference Playoff Race MLS 2026
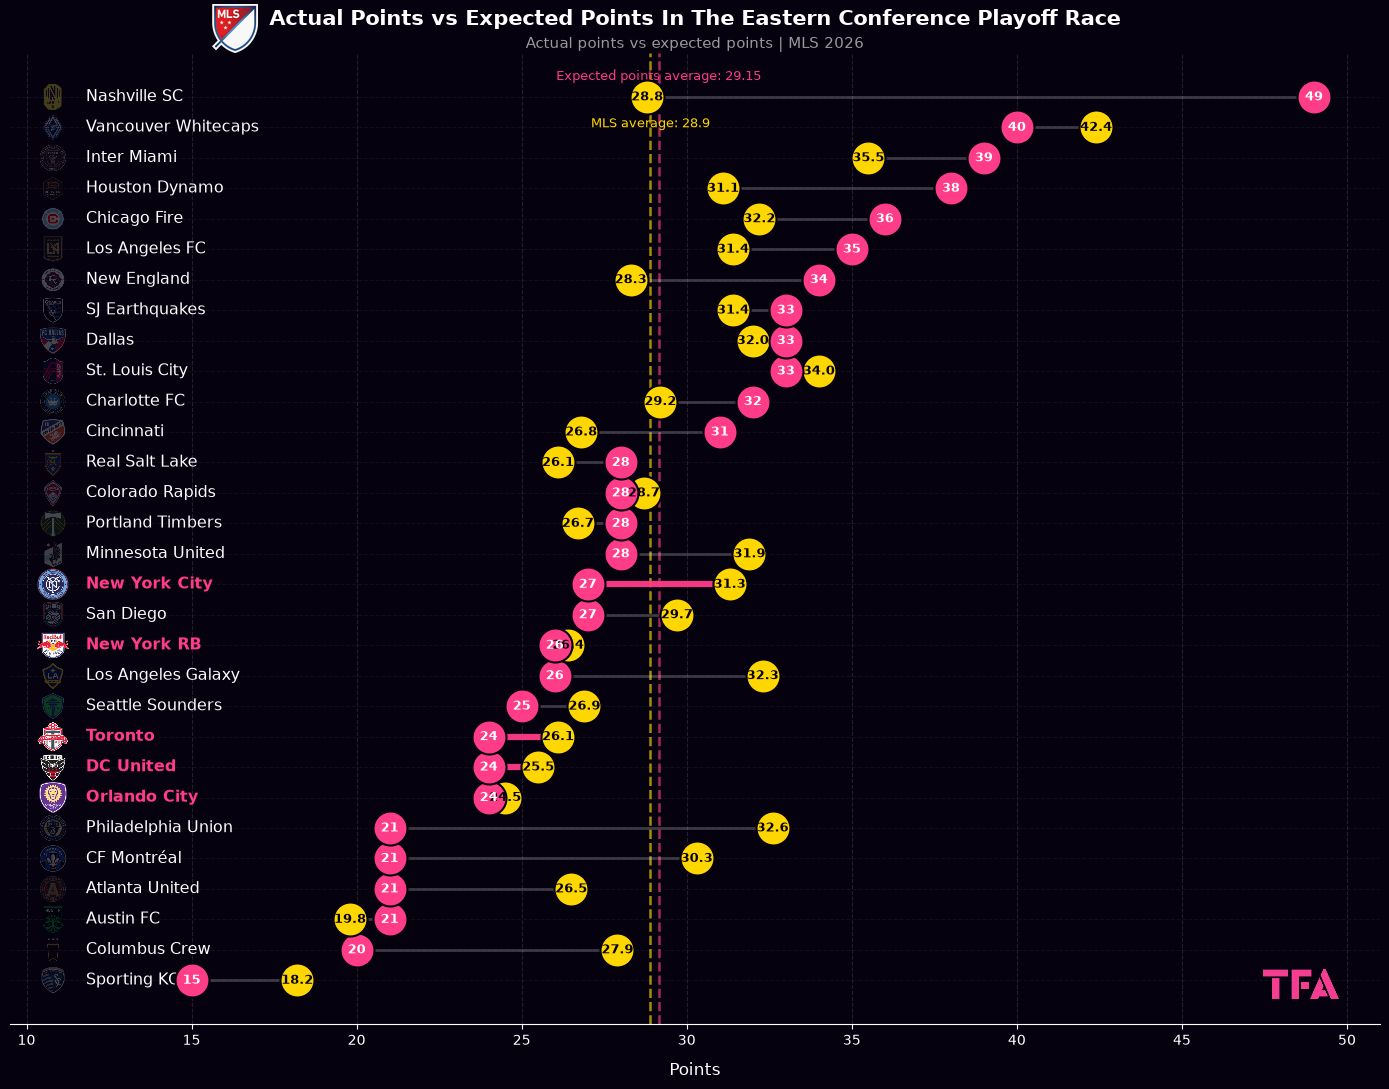
New York City FC show the largest discrepancy, with 27 actual points compared with 31.3 expected, a shortfall of 4.3 points.
Their attacking numbers offer little evidence of major finishing problems, with 35 goals from 34.67 xG, indicating that their points total is more reflective of results in tight matches than poor chance conversion.
Toronto FC have also underperformed their expected total, taking 24 points from 26.1 expected, despite scoring 31 goals from 28.94 xG.
DC United similarly sit 1.5 points below expectation, while Orlando City SC are almost exactly on their underlying level at 24 points from 24.5 expected.
New York Red Bulls, meanwhile, have 26 points from 26.4 expected, despite scoring only 31 goals from 37.2 xG, highlighting how their overall results remain remarkably close to expectation despite significant attacking underperformance.
Five Different Attacking Identities In The Playoff Race
The five teams competing for the Eastern Conference’s final playoff places have developed distinctly different attacking approaches, with their dribbling numbers highlighting how they seek to create and exploit space.
New York Red Bulls are the clear outlier, ranking first across MLS for successful dribbles with 442, or 18.97 per 90, comfortably above the league average of 14.08.
Total Dribbling & Dribble Efficiency In MLS 2026
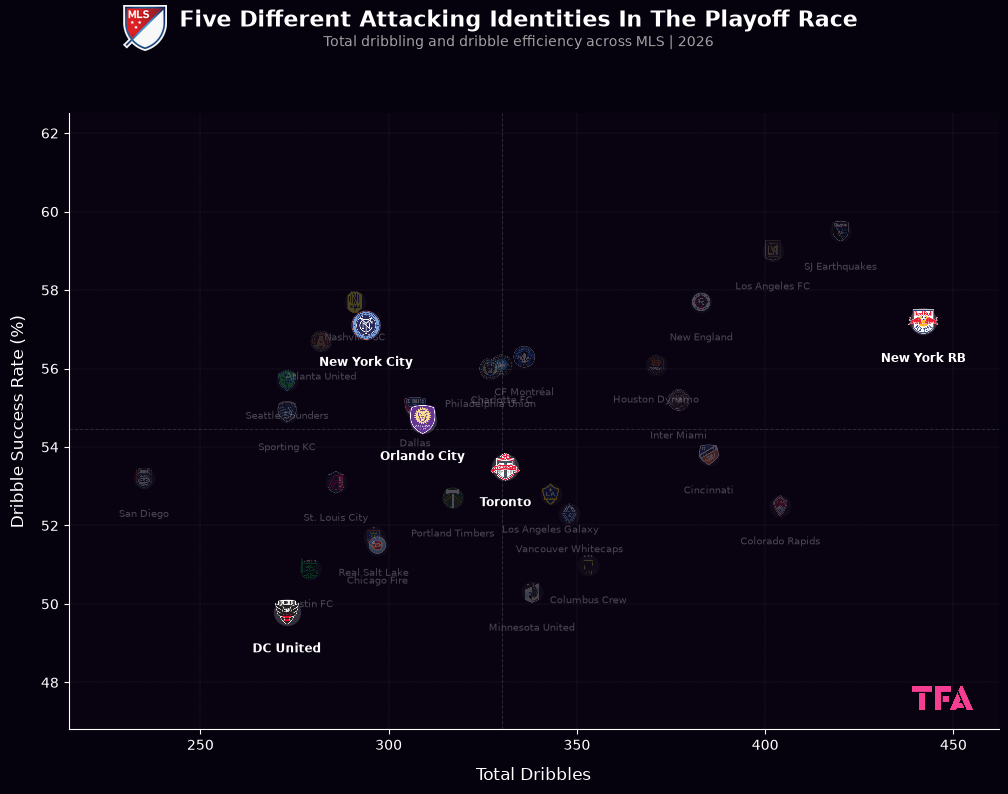
Their output reflects Michael Bradley’s attempt to evolve the club’s traditional high-intensity identity into a more ball-oriented model, with greater emphasis on playing through opponents.
The NYCFC approach is more controlled, with 294 successful dribbles at 12.60 per 90, below the league average, consistent with Pascal Jansen’s emphasis on structure, high-tempo possession and coordinated movement.
Orlando City are similarly below average, recording 309 successful dribbles at 13.02 per 90, suggesting a greater reliance on collective progression and movement than repeated 1v1 actions.
Crossing provides another clear distinction between the five teams, with Orlando City standing out as the most prolific side in the entire MLS.
Width As An Attacking Route - Total Crossing Volume & Crossing Efficiency Across MLS 2026
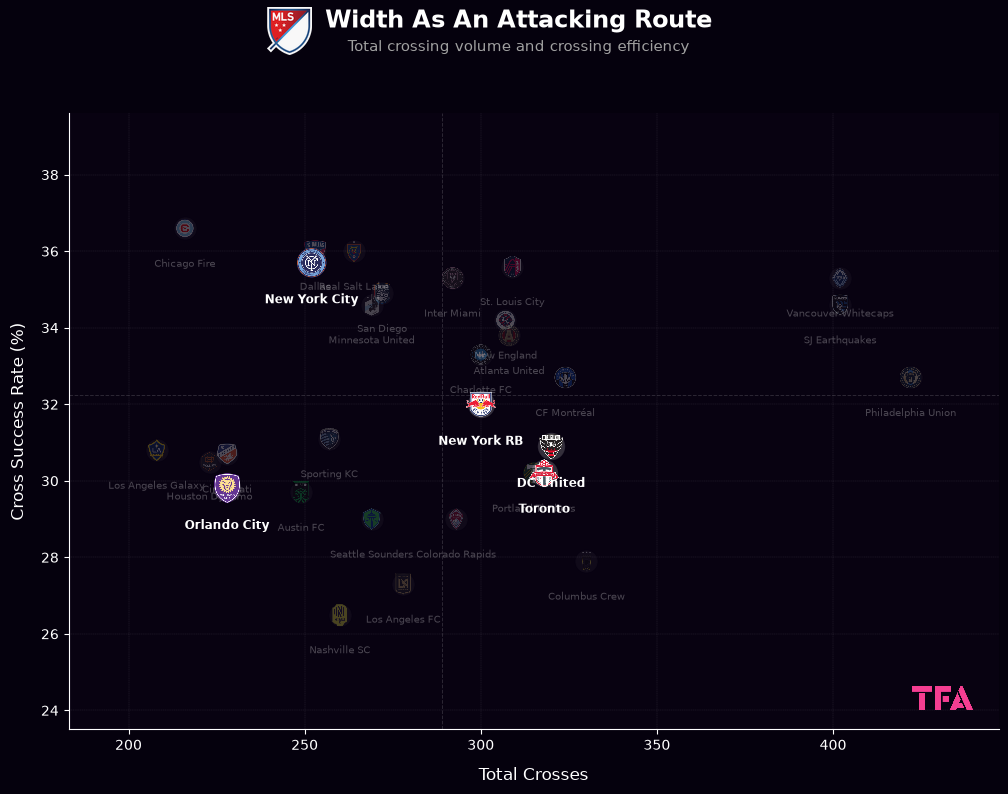
DC United lead the five playoff contenders with 320 crosses, averaging 13.62 per 90 minutes, the highest figure among the group and one of the strongest outputs in MLS.
Their approach isn’t simply about volume, but also about consistently using both flanks to move the ball into dangerous areas, with 174 crosses coming from the right and 140 from the left.
They have also delivered 46 crosses into the six-yard box, highlighting a clear intention to turn wide progression into direct service around the goal.
Toronto FC are next among the five with 318 crosses at 13.34 per 90, while New York Red Bulls follow with 300 at 12.88.
The numbers underline DC United’s strong reliance on width as an attacking route.
From Ball-Carrying To Direct Verticality
New York Red Bulls and DC United represent two of the most direct progression models among the five playoff contenders, although they achieve it in different ways.