Manchester United 2026/2027: Why Changing Managers Does Not Fix The Deeper Problems - Data Analysis
Manchester United’s problems run deeper than Michael Carrick. This data analysis examines years of changing tactical identities, major xG underperformance, declining pressing intensity and the recurring defensive gaps Mauricio Pochettino must fix.

Manchester United sacked Michael Carrick after a run of defeats and poor performances this season, a big drop-off from last season when he first took charge and guided them back to the Champions League.
However, it wasn't only a Michael Carrick issue; it's bigger than him.
Man United have now hired Mauricio Pochettino to try and right the ship, but a familiar pattern has emerged over the last decade with the Red Devils stuck in a managerial cycle of underperformance. Specifically, every new Manchester United manager comes in with a different set of ideas and a different style of play, but is unable to fix the club's underlying problems, thus resulting in their sacking.
In this Manchester United data analysis, we look at Carrick's latest period, what went wrong, and why Man United keep ending up in the same place, no matter who's in charge.
Different Managers, No Clear Identity
Since Sir Alex Ferguson left in 2013, United have changed managers 13 times (including interim / caretakers) with each one bringing a different way of playing.
List of Manchester United Managers Since Sir Alex Ferguson Left
- David Moyes - July 2013 to April 2024
- Ryan Giggs - April 2024 to July 2024
- Louis van Gaal - July 2024 to May 2016
- José Mourinho - May 2016 to December 2018
- Ole Gunnar Solskjær - December 2018 to November 2021
- Michael Carrick - November 2021 to December 2021
- Ralf Rangnick - December 2021 to May 2022
- Erik ten Hag - May 2022 to October 2024
- Ruud van Nistelrooy - October 2024 to November 2024
- Rúben Amorim - November 2024 to January 2026
- Darren Fletcher - January 2026
- Michael Carrick - January 2026 to November 2026
- Mauricio Pochettino - Since November 2026
During this time, the Manchester United squad has kept adapting without ever building a clear identity.
Manchester United Managers After Alex Ferguson Possession % & Passes Per Game Stats
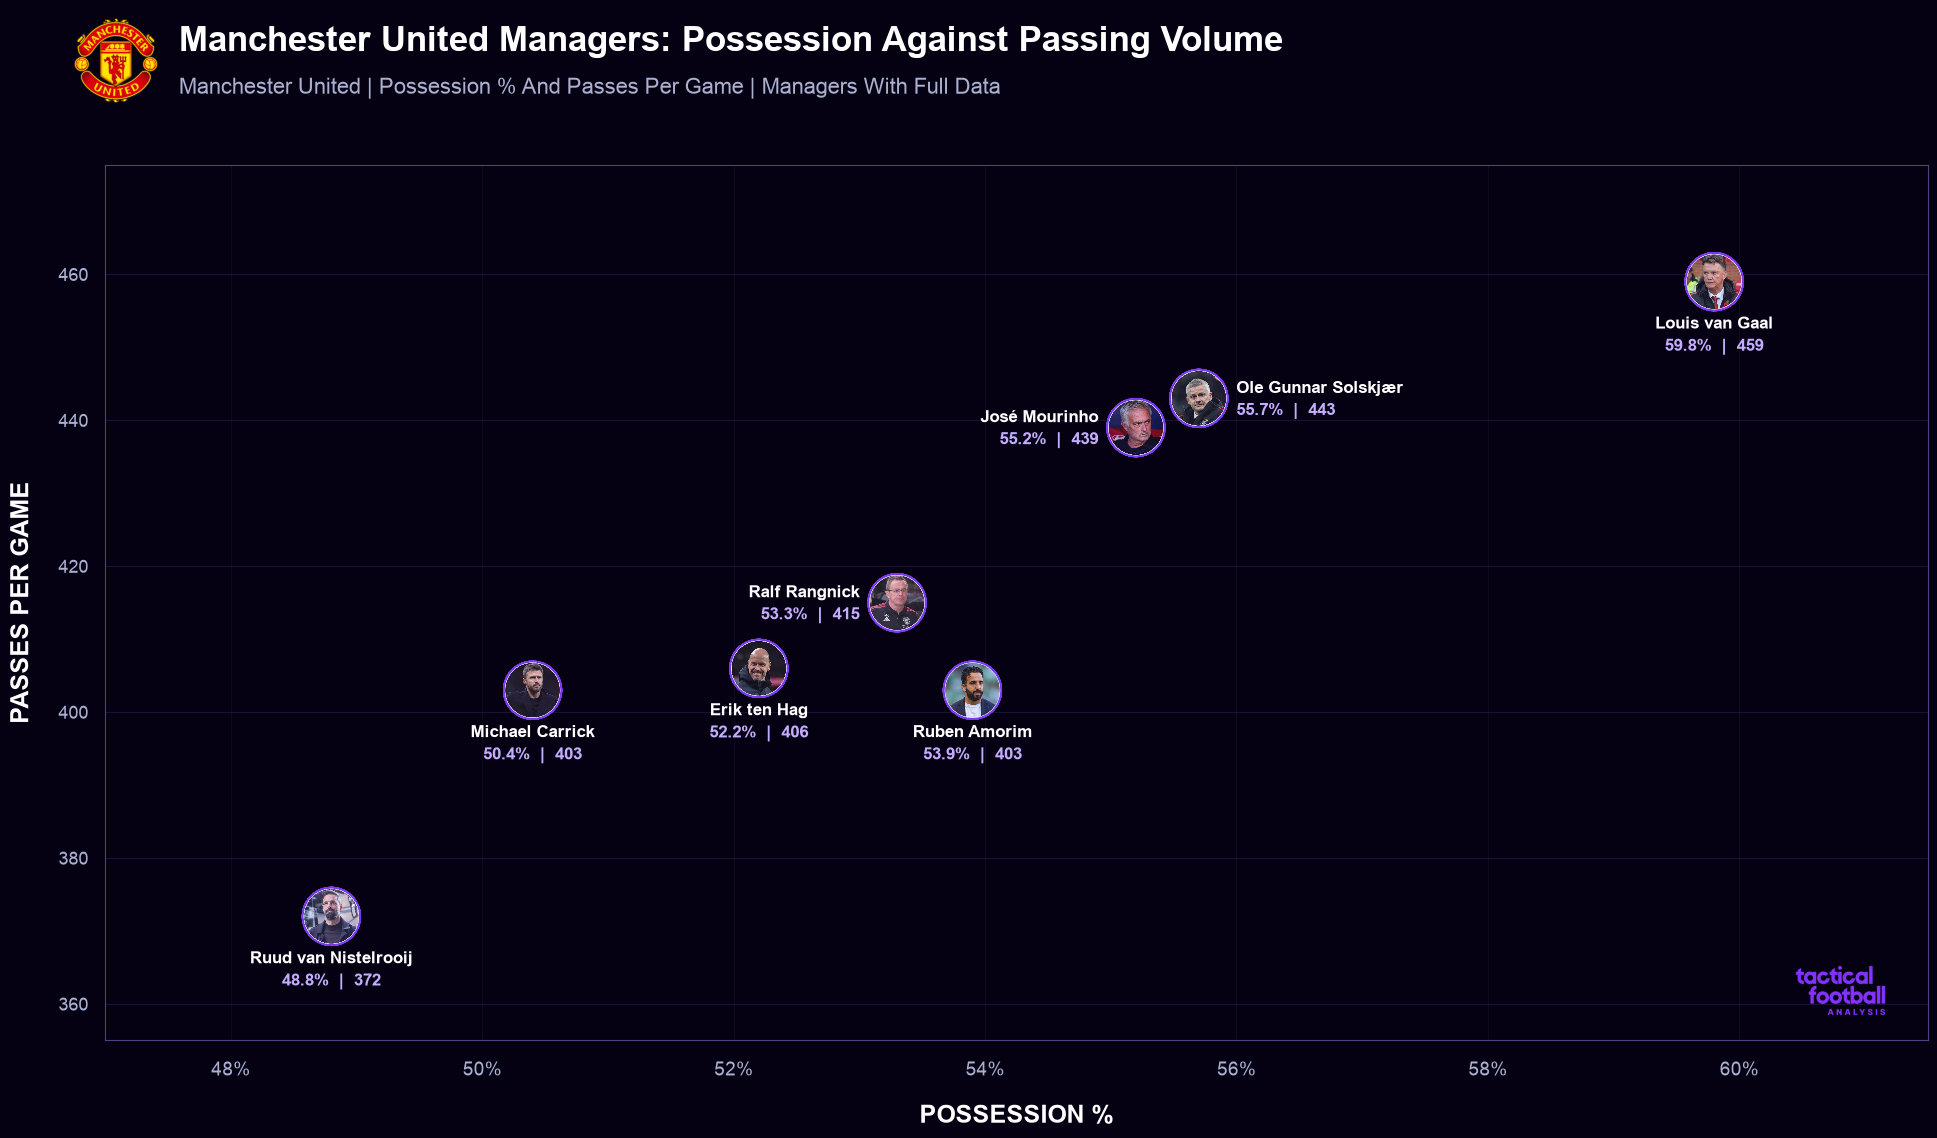
Possession ranged from 48.8% to 59.8%, while passes per game varied from 372 to 459.
They have gone from David Moyes' crossing game to Louis van Gaal's possession, José Mourinho's cautious setup, Ole Gunnar Solskjær's counterattacks, Ralf Rangnick's pressing, Erik Ten Hag's vertical football, Rúben Amorim's 3-4-3 with wing-backs and Carrick's patient build-up.
Manchester United Managers Goals Scored & Conceded Per Match
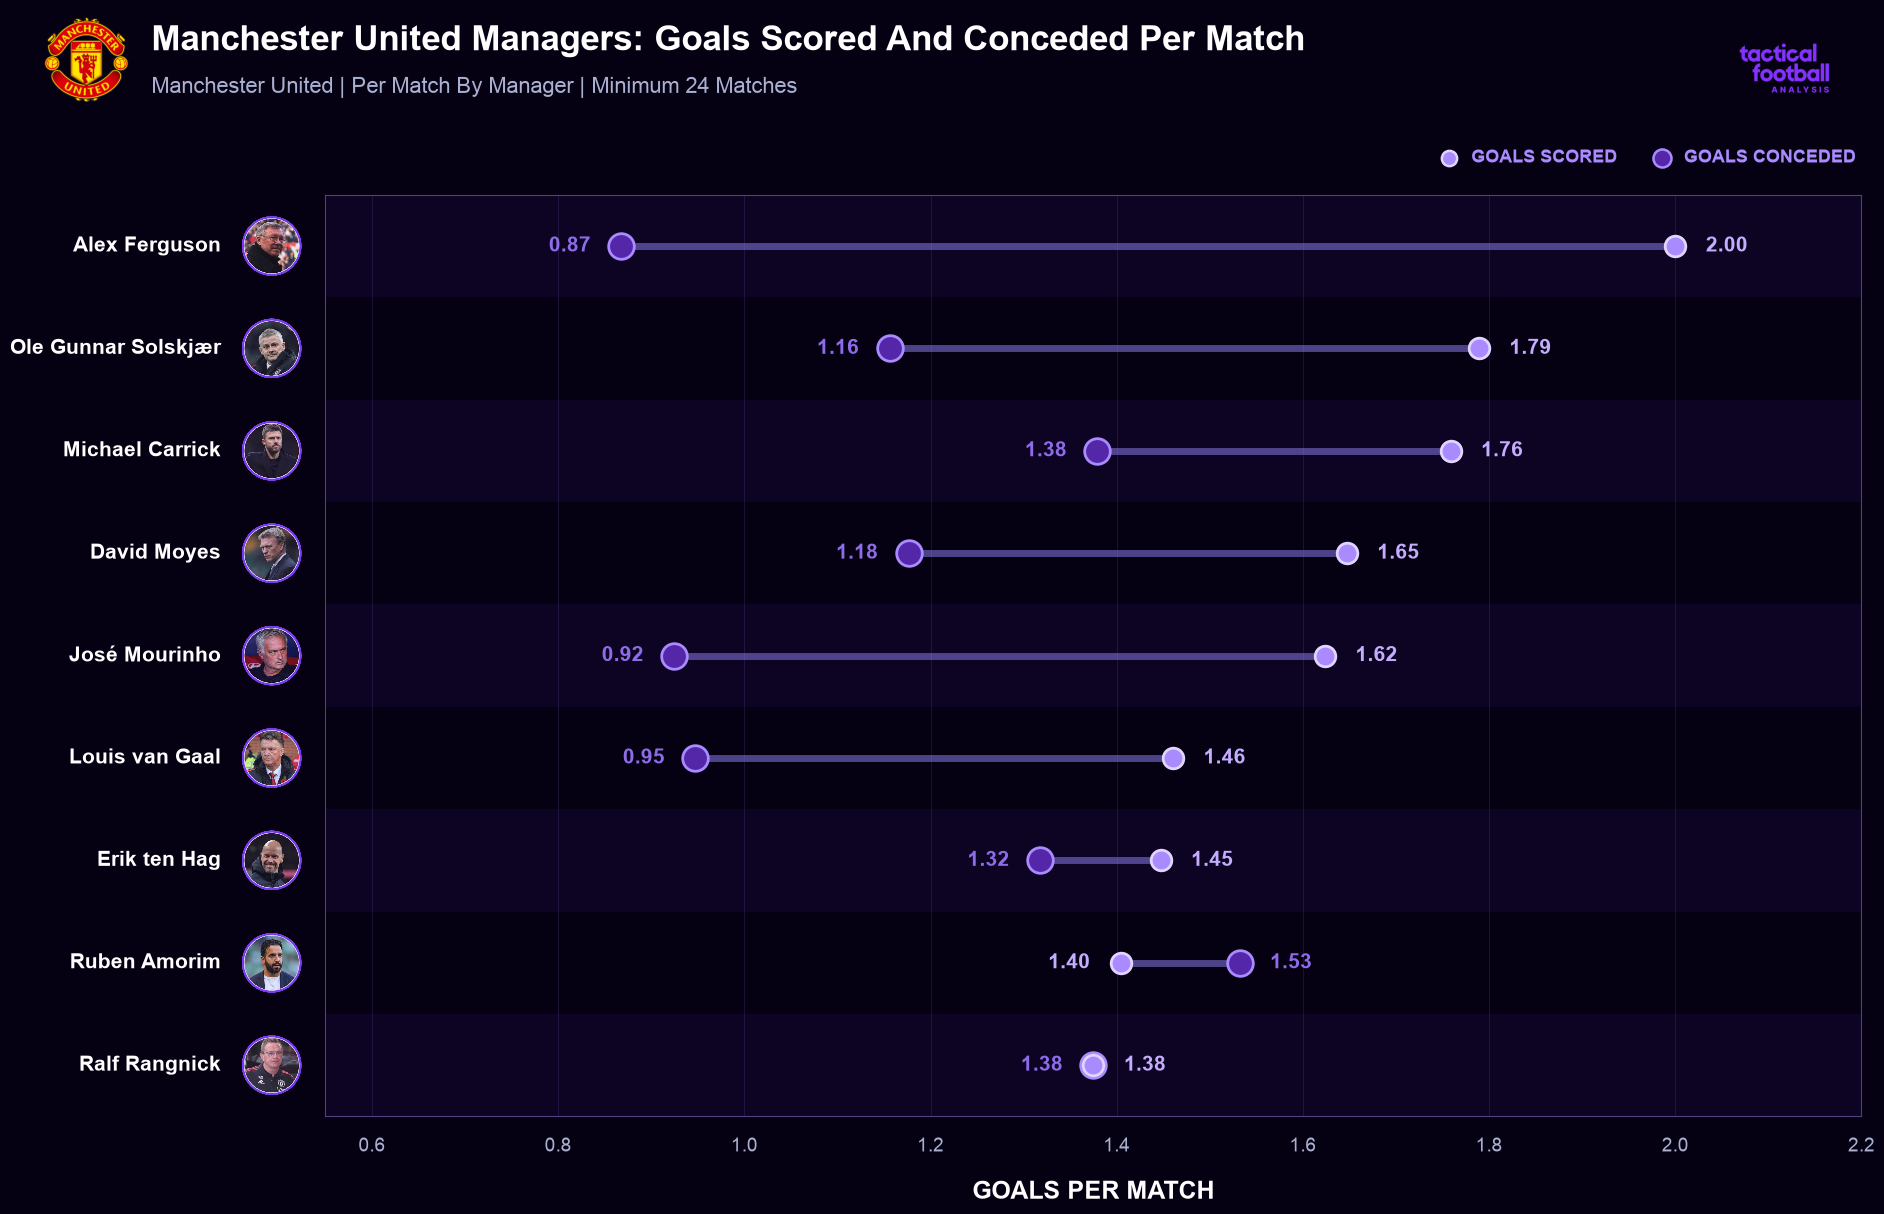
Ferguson's side averaged two goals per game and conceded just 0.87, and since then, no manager has matched that balance.
Carrick's side scored 1.76 per game but conceded 1.38, while Ten Hag's conceded 1.32 and Amorim scored 1.53 but conceded 1.4.
Manchester United Managers Win Rate Against Matches Managed
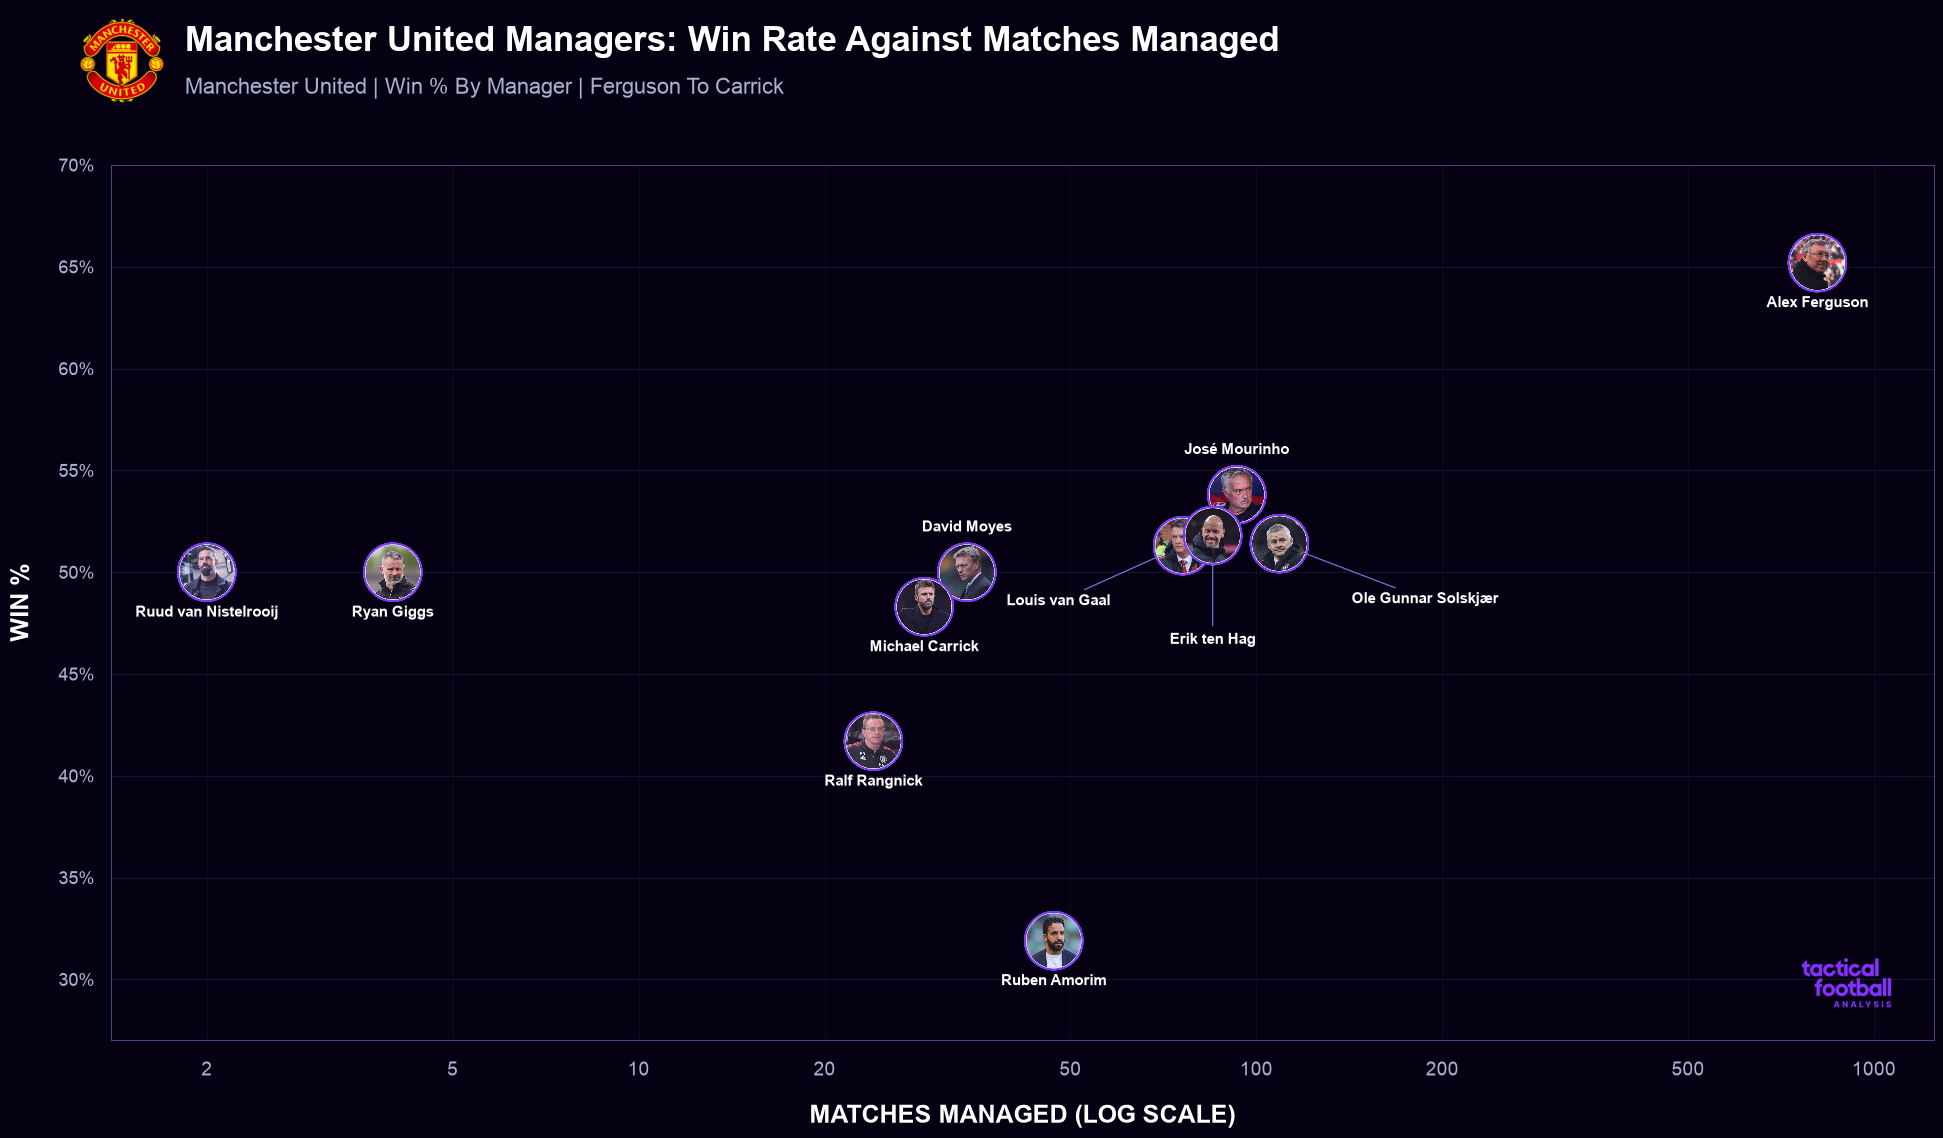
Ferguson won 65.2% of his 810 matches, and since he left, Mourinho has the best win rate at 53.8%, followed by Ten Hag (51.8%), Ole (51.4%) and Van Gaal (51.3%).
Carrick's 48.3% win rate doesn't tell the full story; it combines last season's successful run with just one win from his first ten league games this season, leaving United in the relegation places and costing him his job.
Was Michael Carrick's Manchester United Side Really That Bad This Season?
Man United picked up only eight points from their first 10 games and spent the two-week international break sitting in the relegation places.
However, the numbers tell us a different story.
Premier League 2026/2027 Points Vs Expected Points
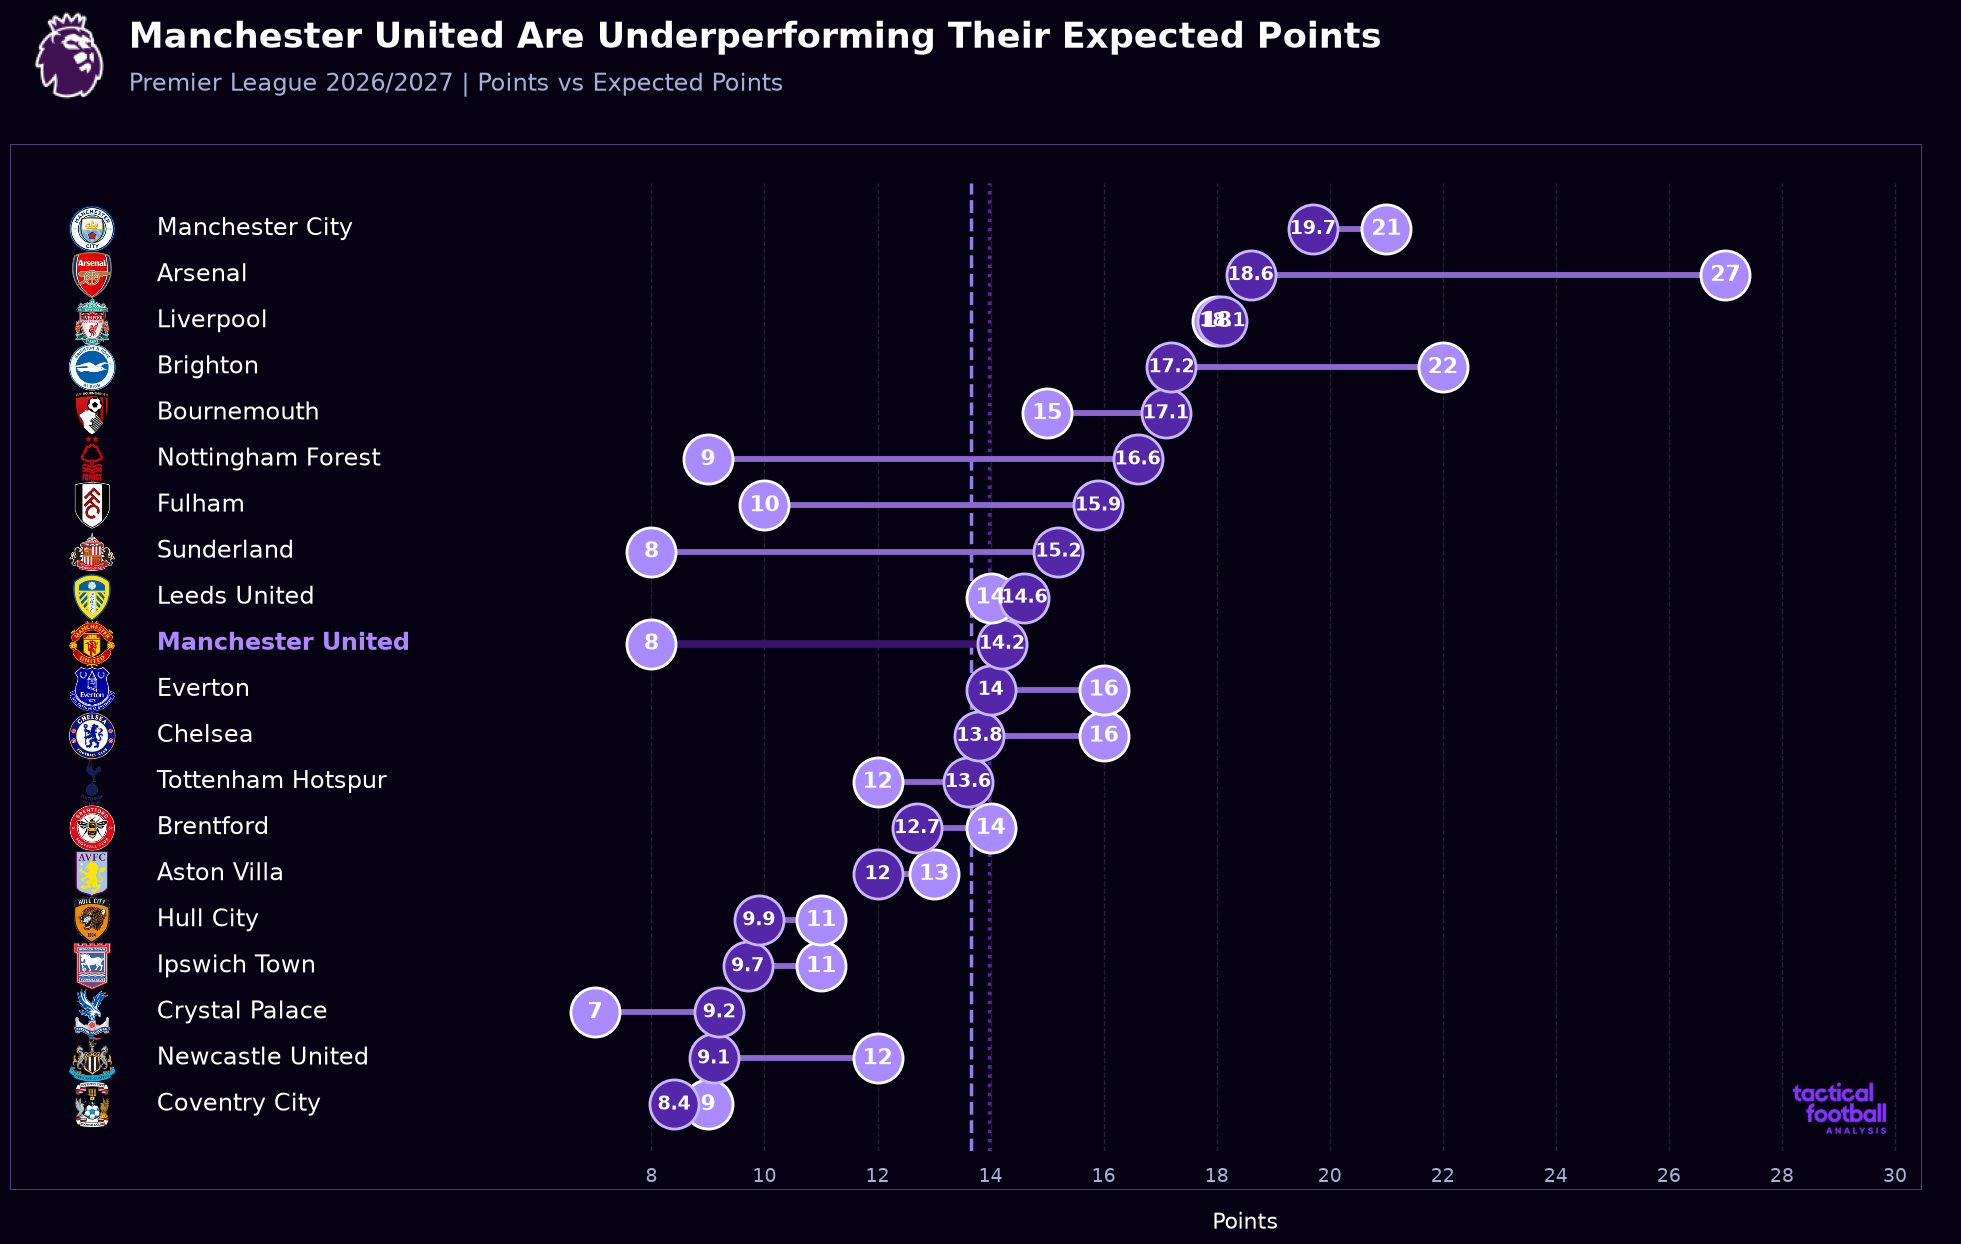
Their expected points total stood at 14.2, compared to just eight actual points.
That's a gap of more than six points, which would have left them 10th in the expected points table.
But this is a general number, and it needs clarification
The xG numbers give us a pretty good idea.
Premier League 2026/2027 Goals Scored Vs Expected Goals
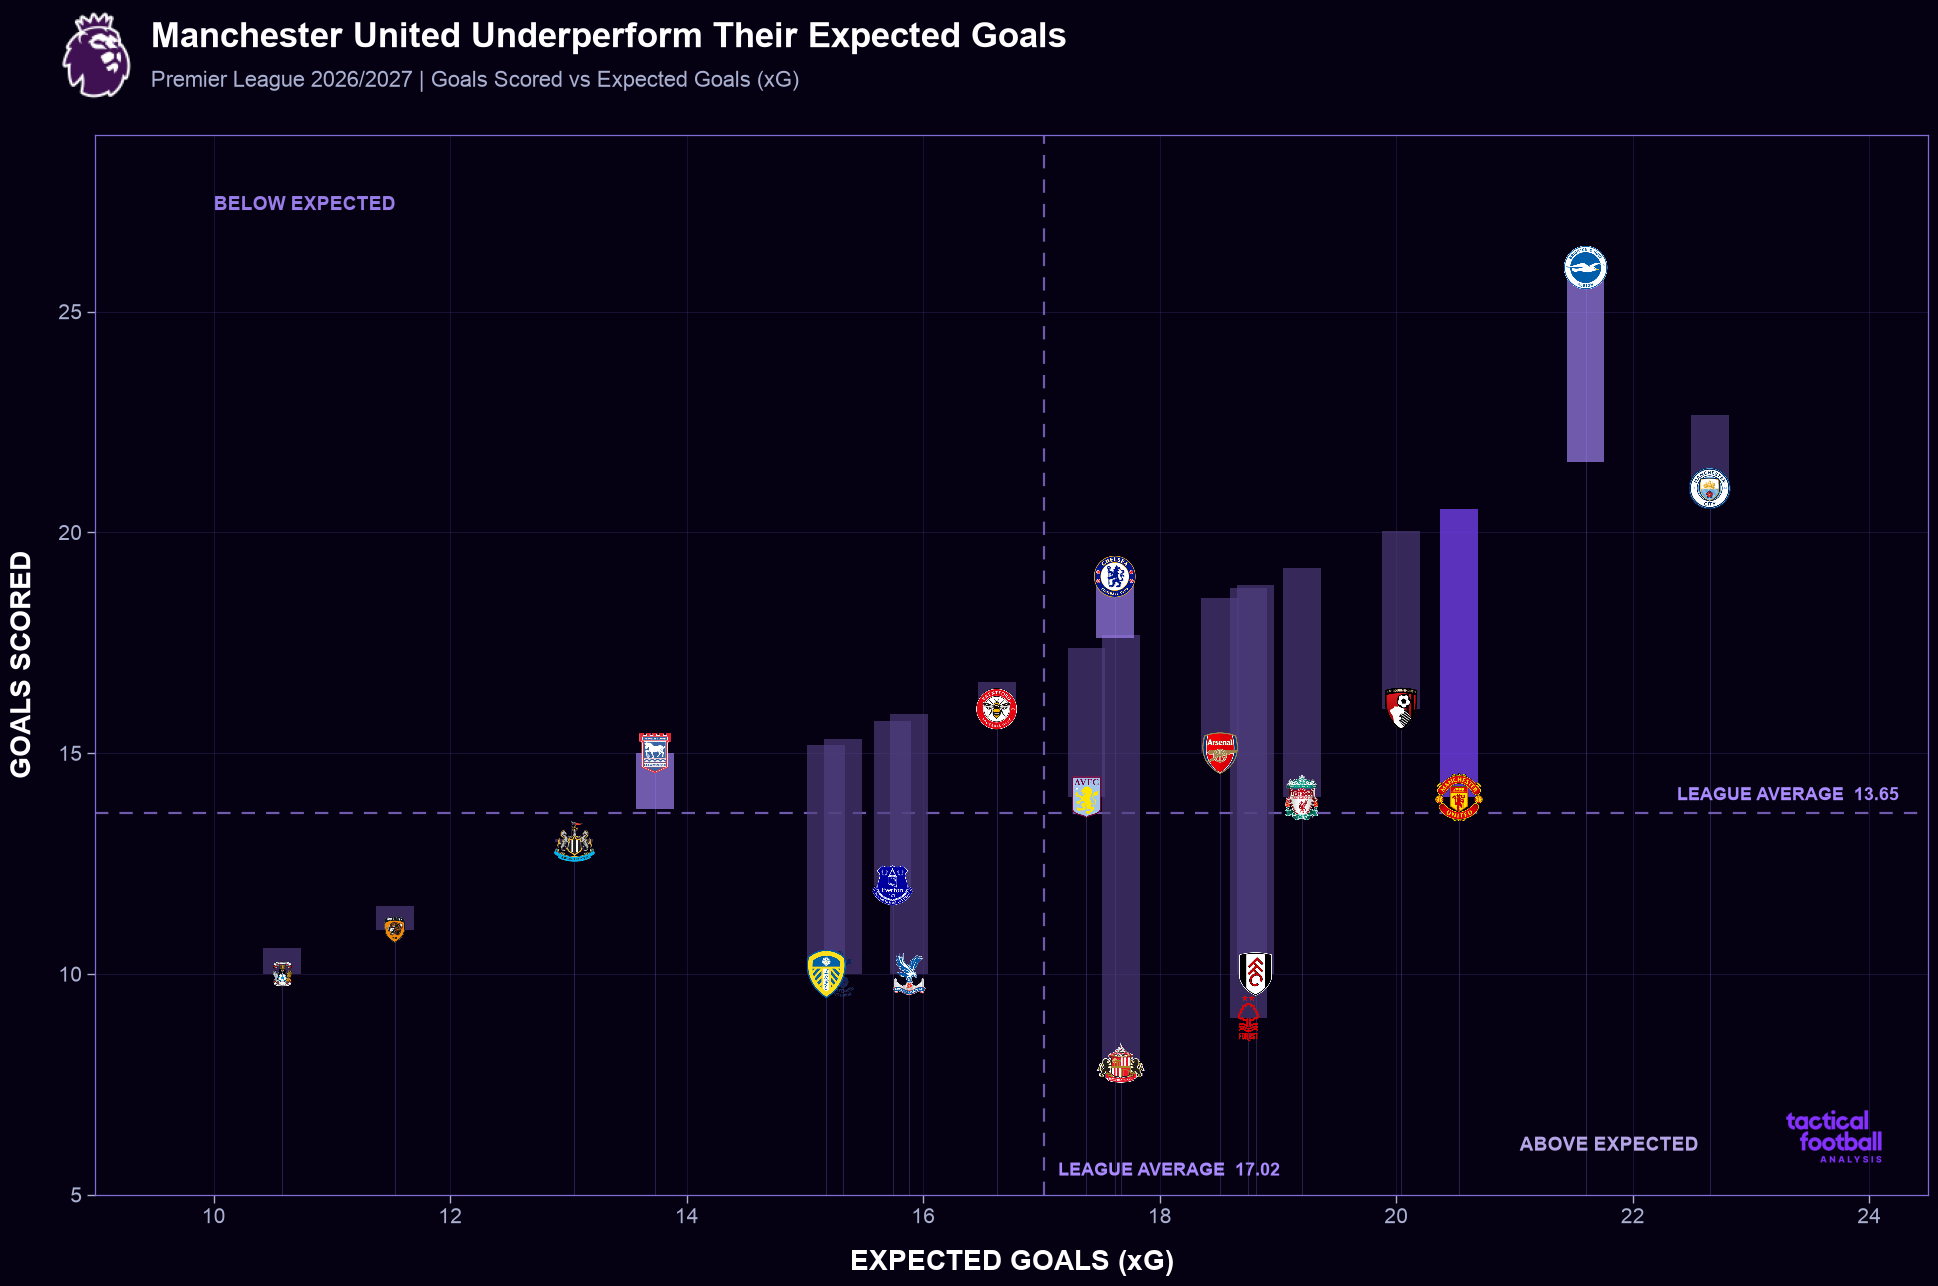
United had the third-highest xG in the league at 20.53, with only Manchester City (22.65) and Brighton (21.6) doing better, but they managed only 14 goals.
That's a big difference, and it's the same old problem we discussed in our TFA report on United's summer 2025 signings.
Even before the summer 2025 signings of Matheus Cunha and Bryan Mbeumo, United were struggling to turn chances into goals.
Despite bringing in more firepower, it's still costing them this season.
Premier League 2026/2027 Shots From Outside The Box vs Inside The Penalty Area
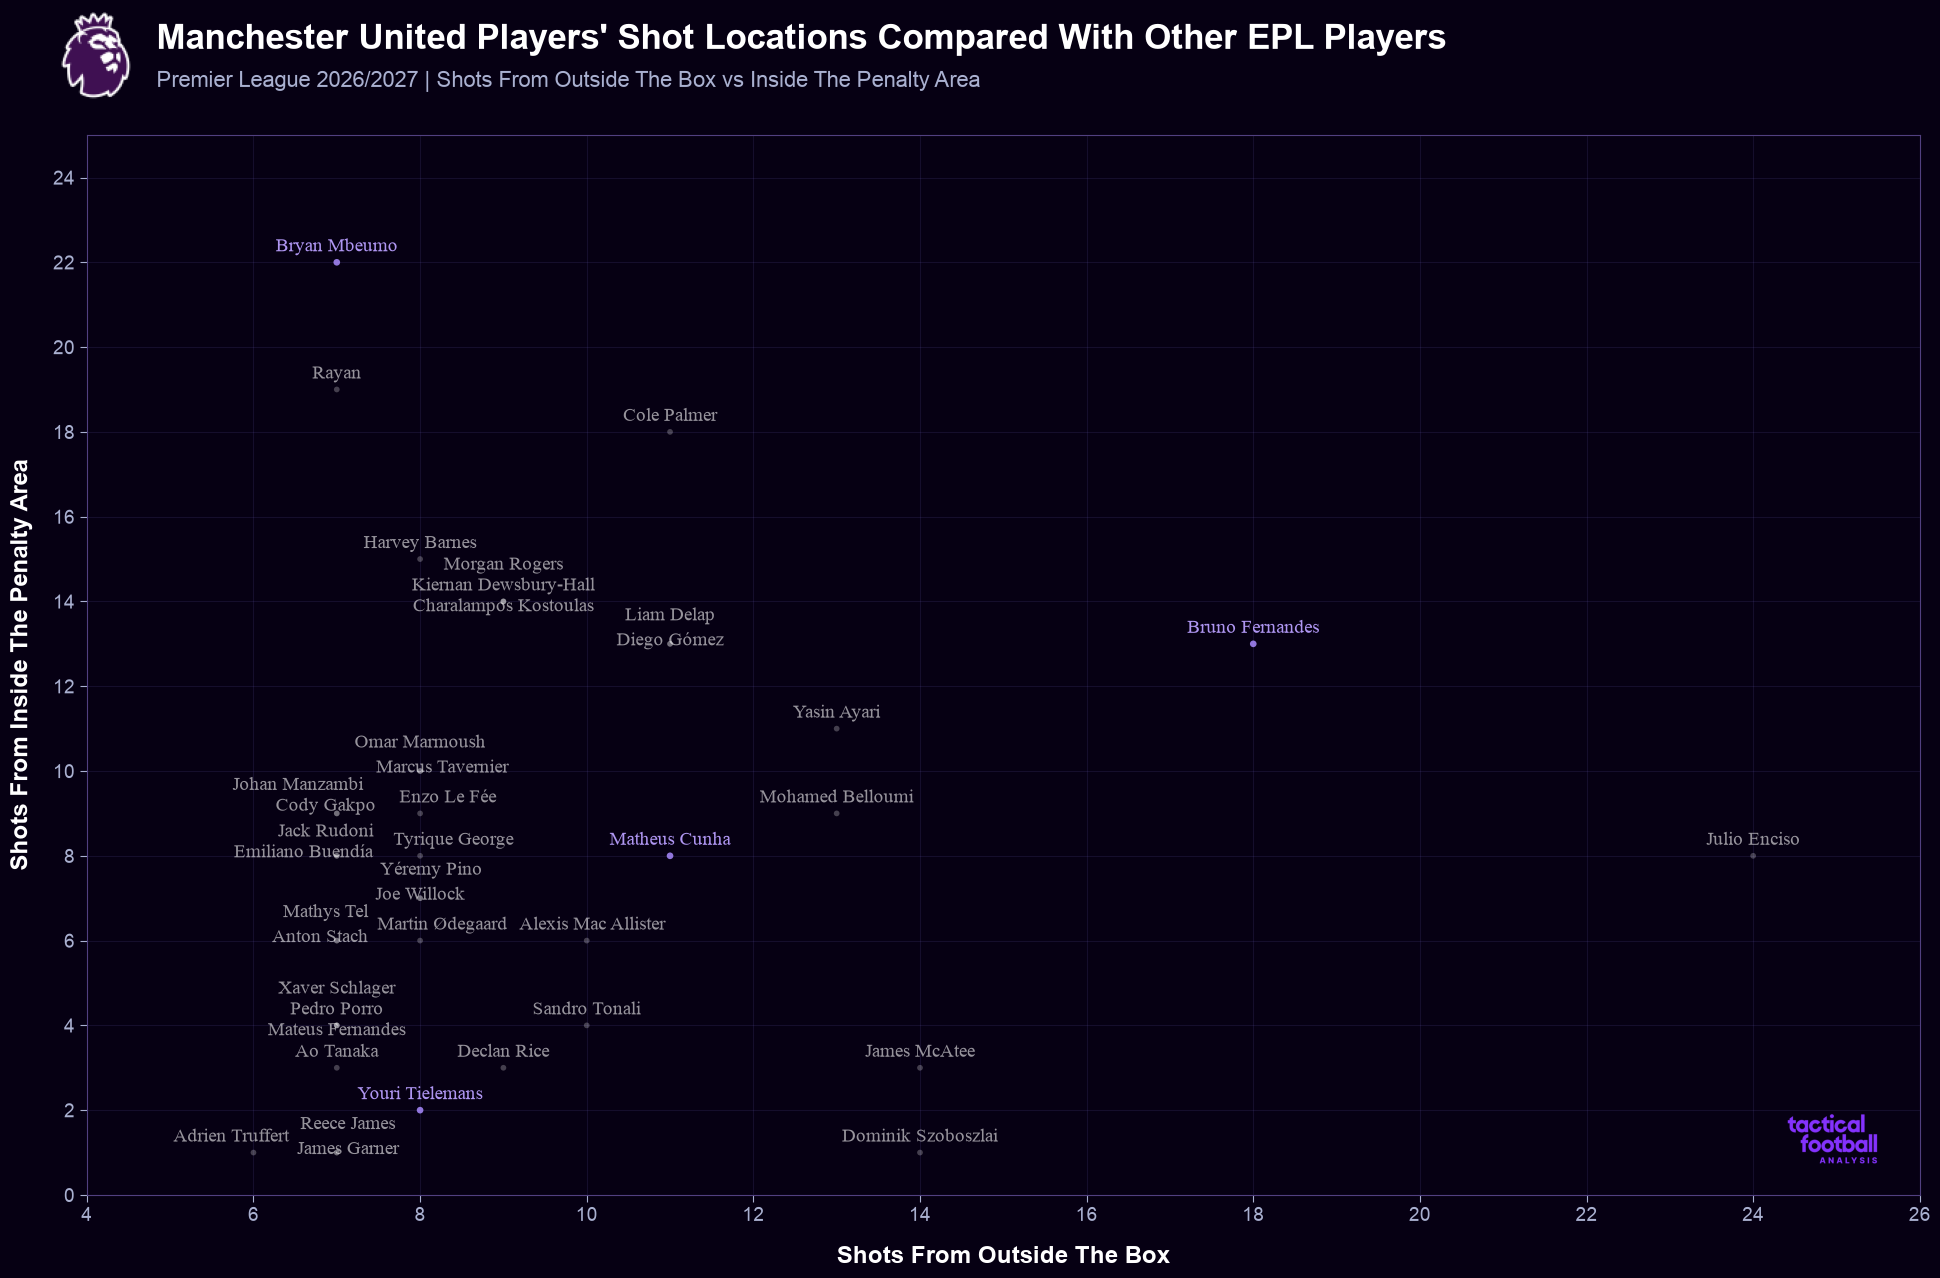
As the chart above shows, Mbeumo has had more shots from inside the box than any other player in the league.
His xG map shows that 22 of his shots have come from inside the area, but he's only scored twice from those attempts.
Bryan Mbeumo Shooting Performance & Shot Locations Premier League 2026/2027
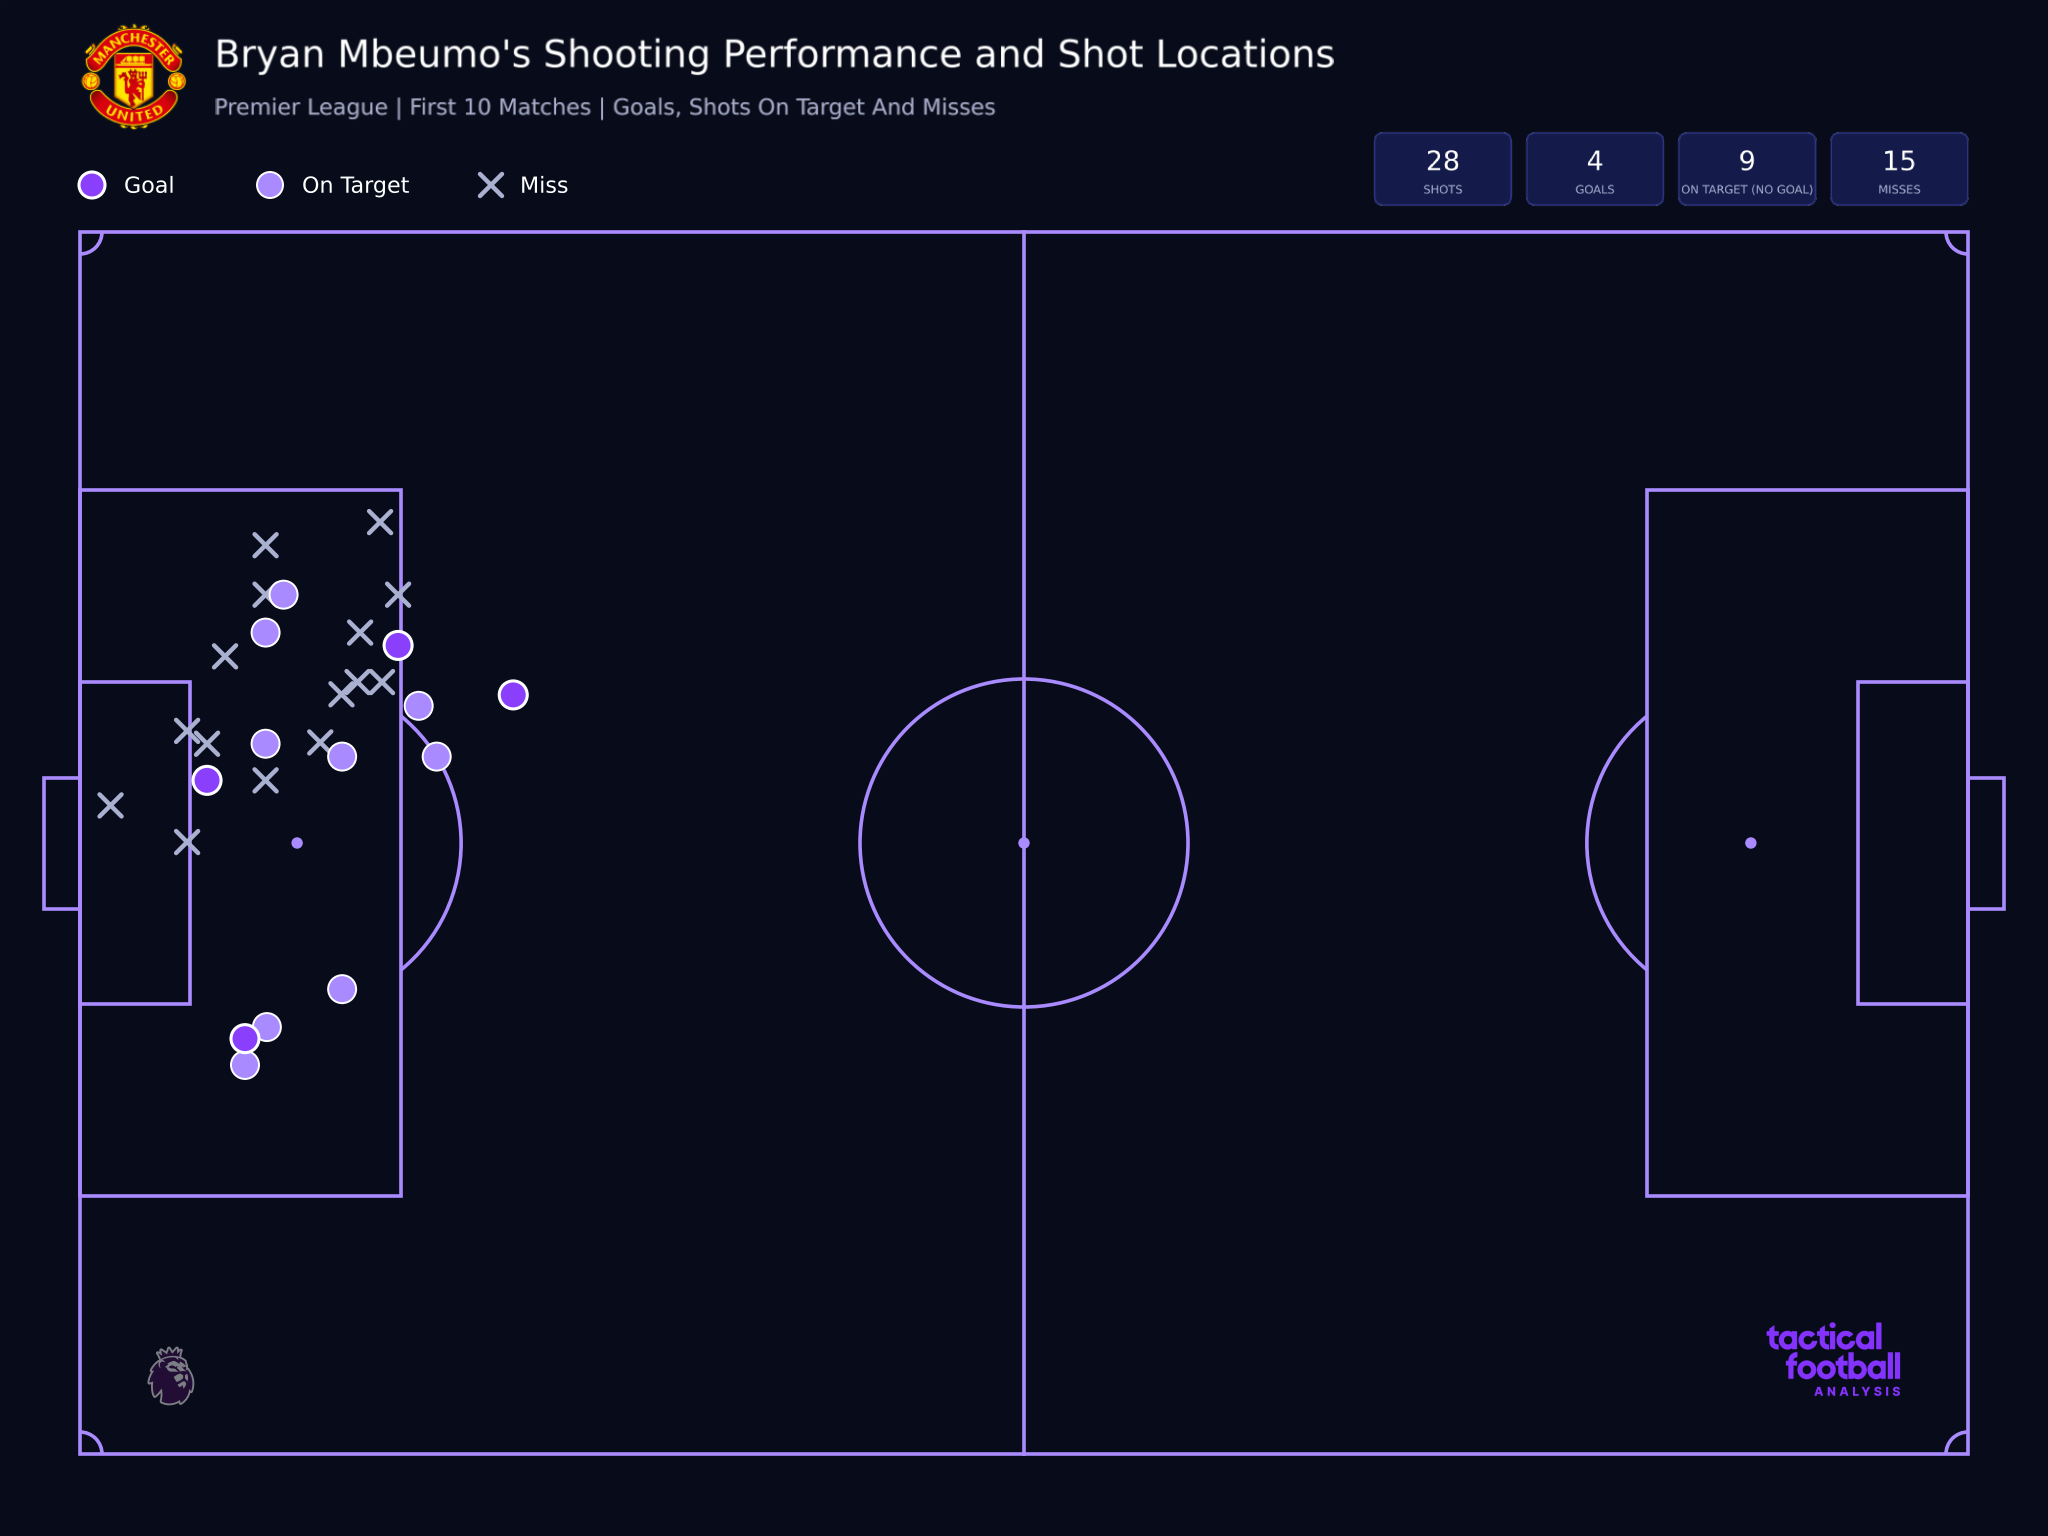
His other two goals have come from outside the box, and he's been one of United's standout players this season.
So it's hard to argue that United aren't getting into the right areas; they're just not making enough of those chances count.
Manchester United Defensive Problems Have Made Things Even Worse
United have had defensive problems this season too, and the same issues keep repeating game after game without any real sign of improvement.
One of the clearest signs is their PPDA, which has jumped to 14.76, their highest figure in the data going back to 2015/2016.
Manchester United PPDA 2015/2016-2026/2027
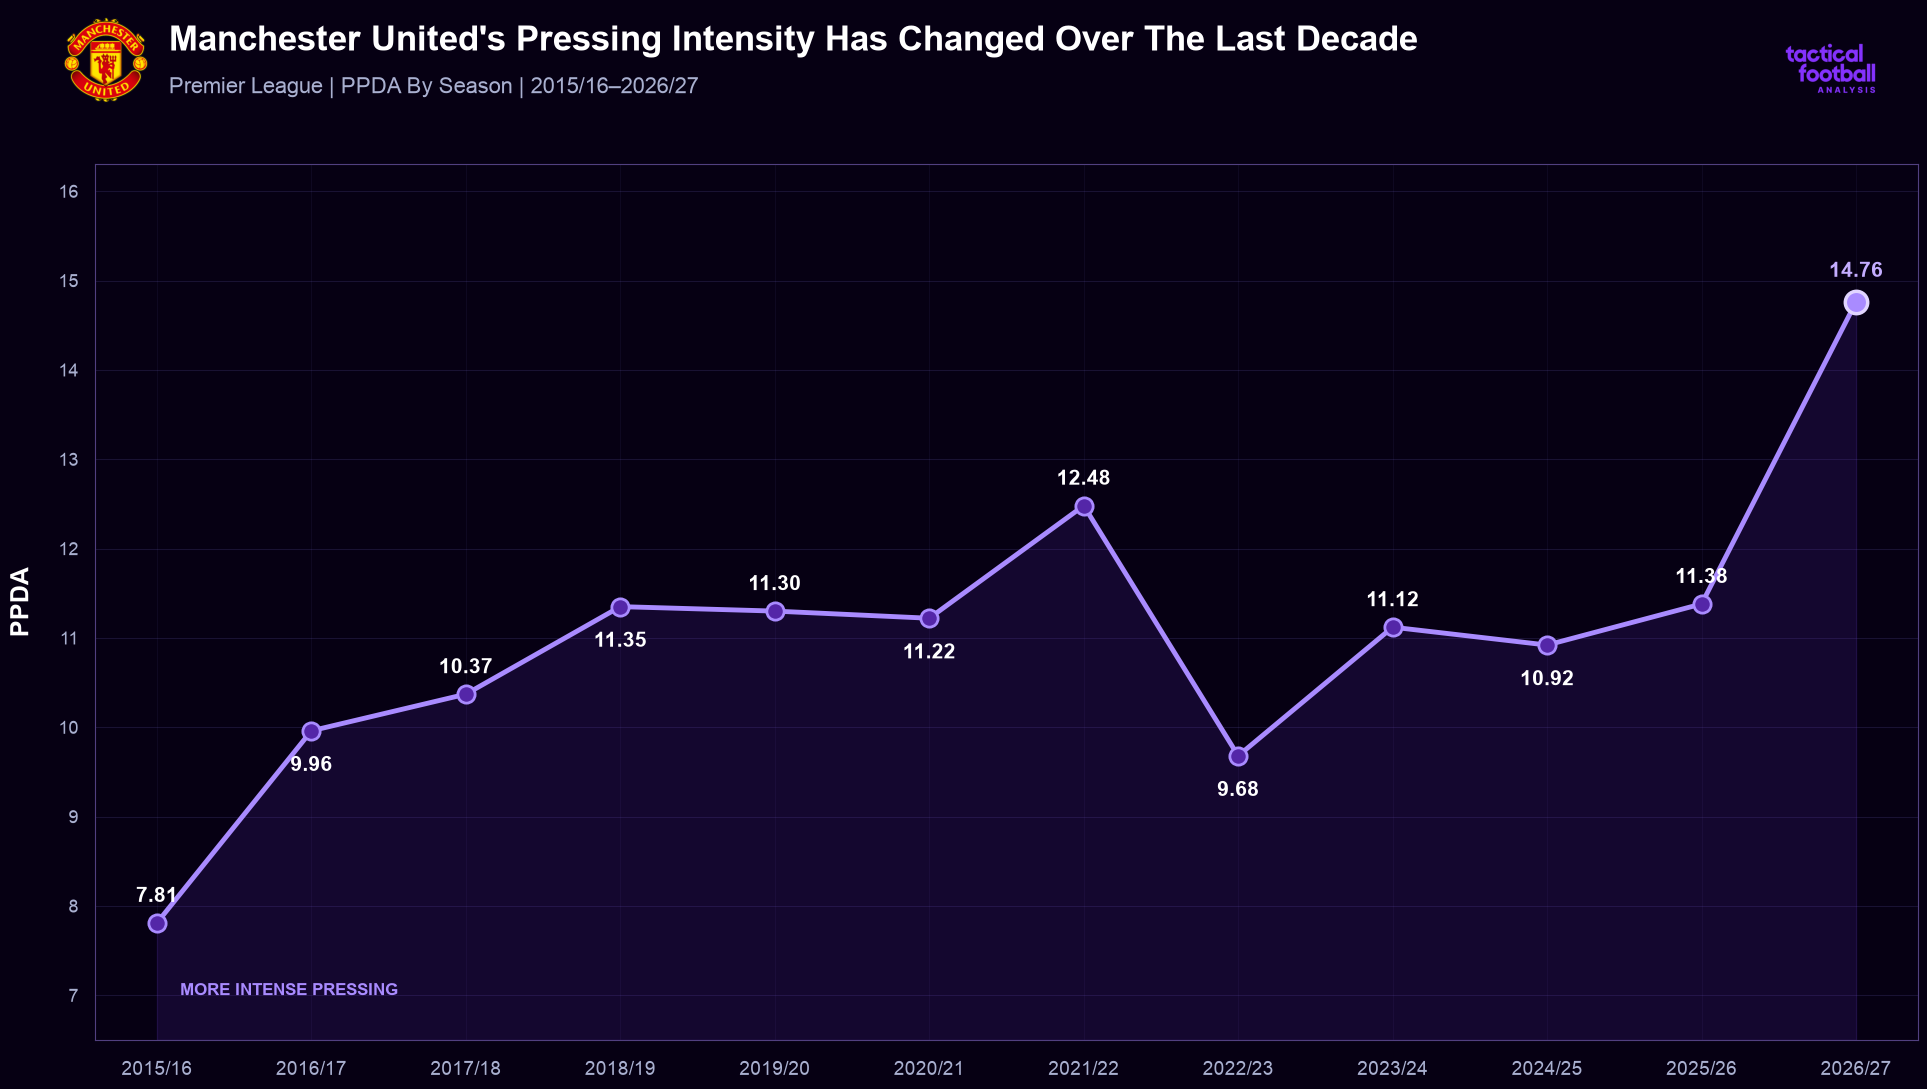
Teams are getting far more passes away before United make a defensive action, giving opponents more time to play through them and find gaps.
The numbers back that up: United have conceded 17.51 xG, and what really stands out is their xG per shot against.
At 0.159, it's the highest figure in the league.
Premier League 2026/2027 xG Against Vs xG Per Shot Against
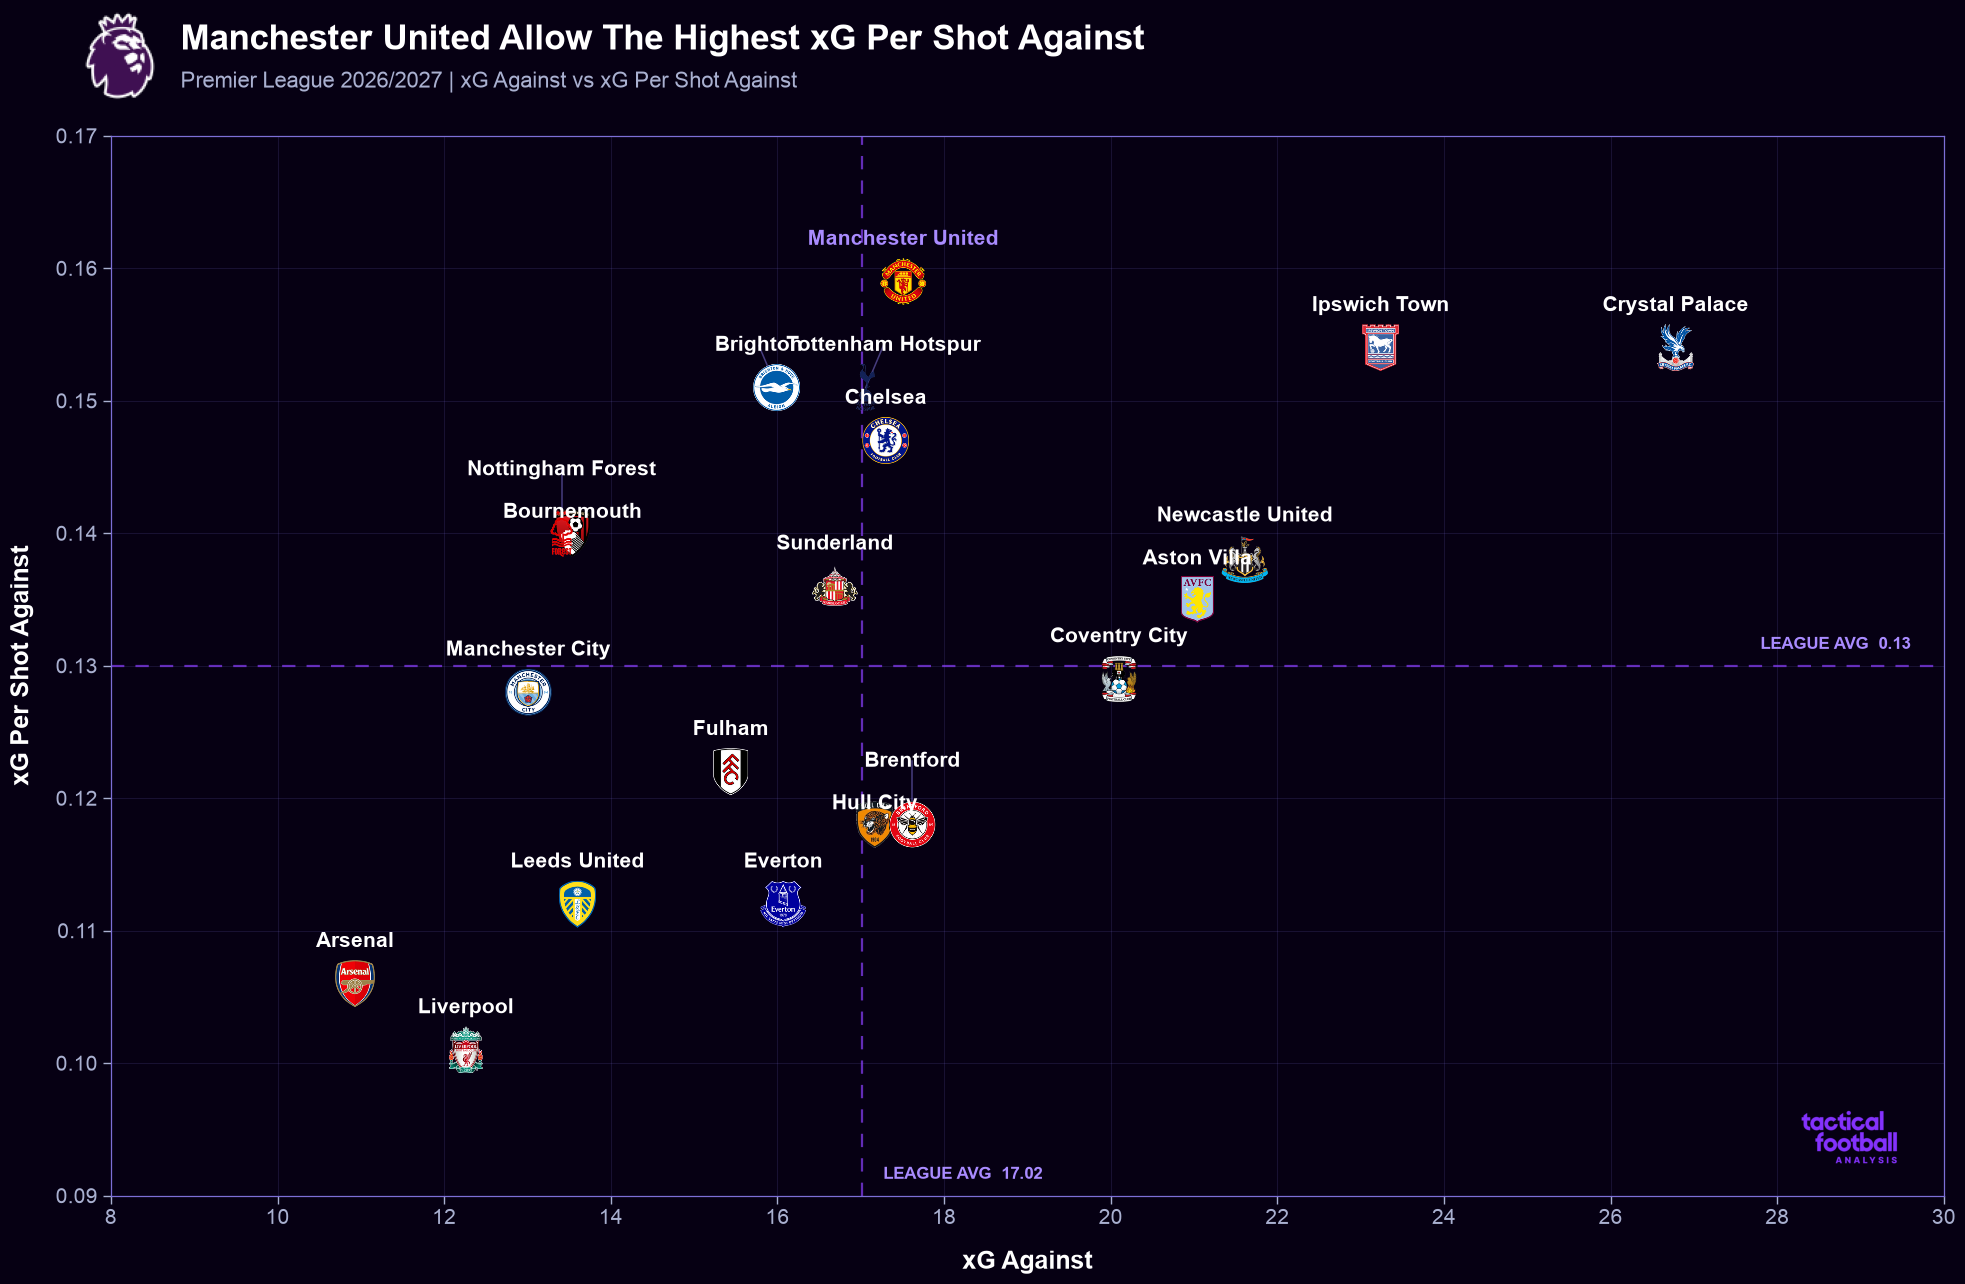
So it's not just about how many shots they're facing, but the quality of those chances too.
They're allowing opponents to get shots away from much better positions than most other sides.
Set-pieces have been another big headache.
United have already conceded six goals from them, while facing 41 shots and 5.4 xG against from dead-ball situations.
Premier League 2026/2027: Manchester United Have The Third-Highest xG Against From Set-Pieces
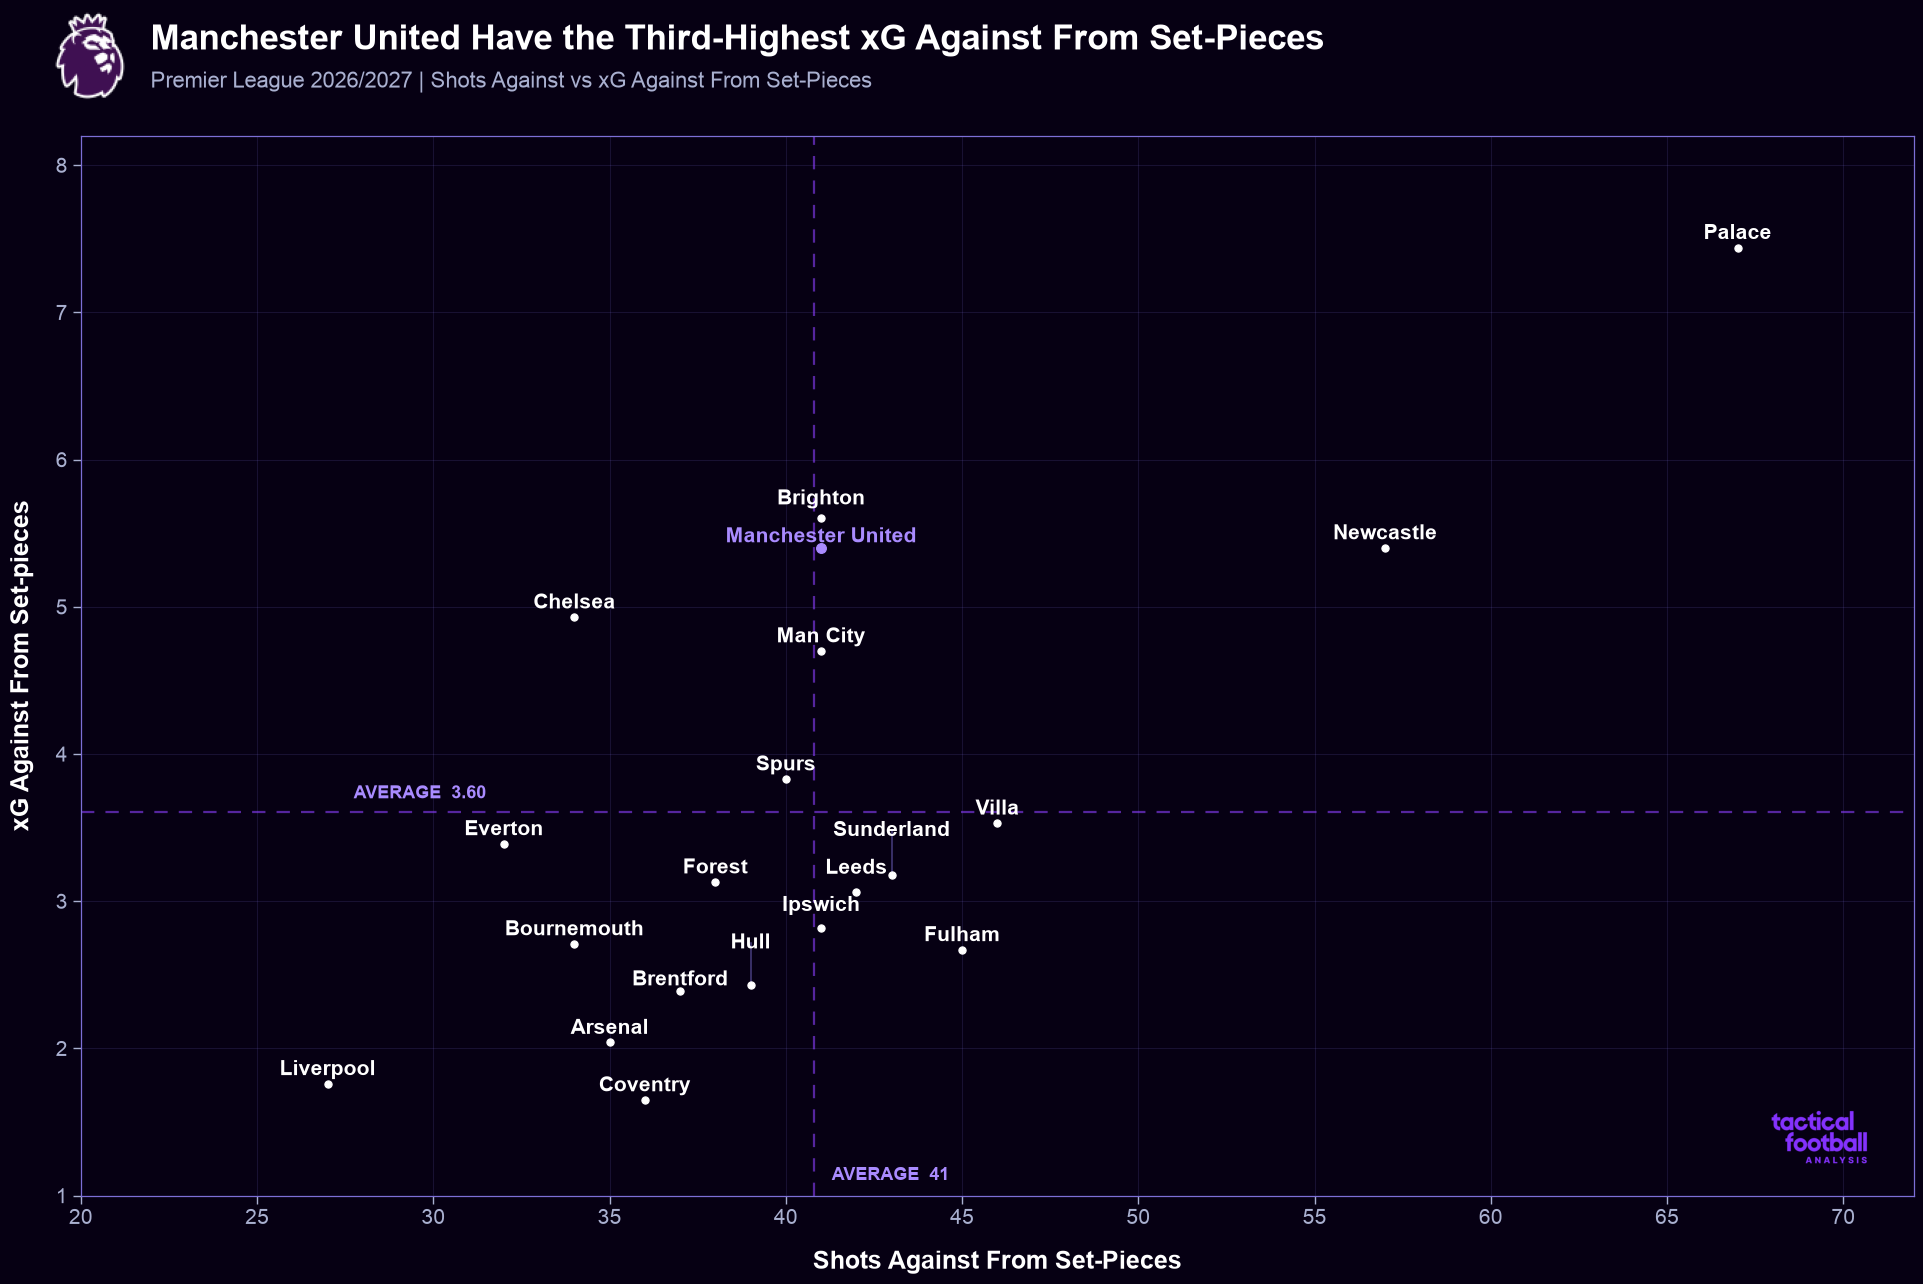
That xG Against figure is among the highest in the league, behind only Crystal Palace and Brighton, while level with Newcastle United.
Manchester United Keep Leaving The Same Gaps Down The Sides
Another real problem is United's defensive shape.
They don't seem comfortable shifting across as a unit when the ball moves from one side to the other.
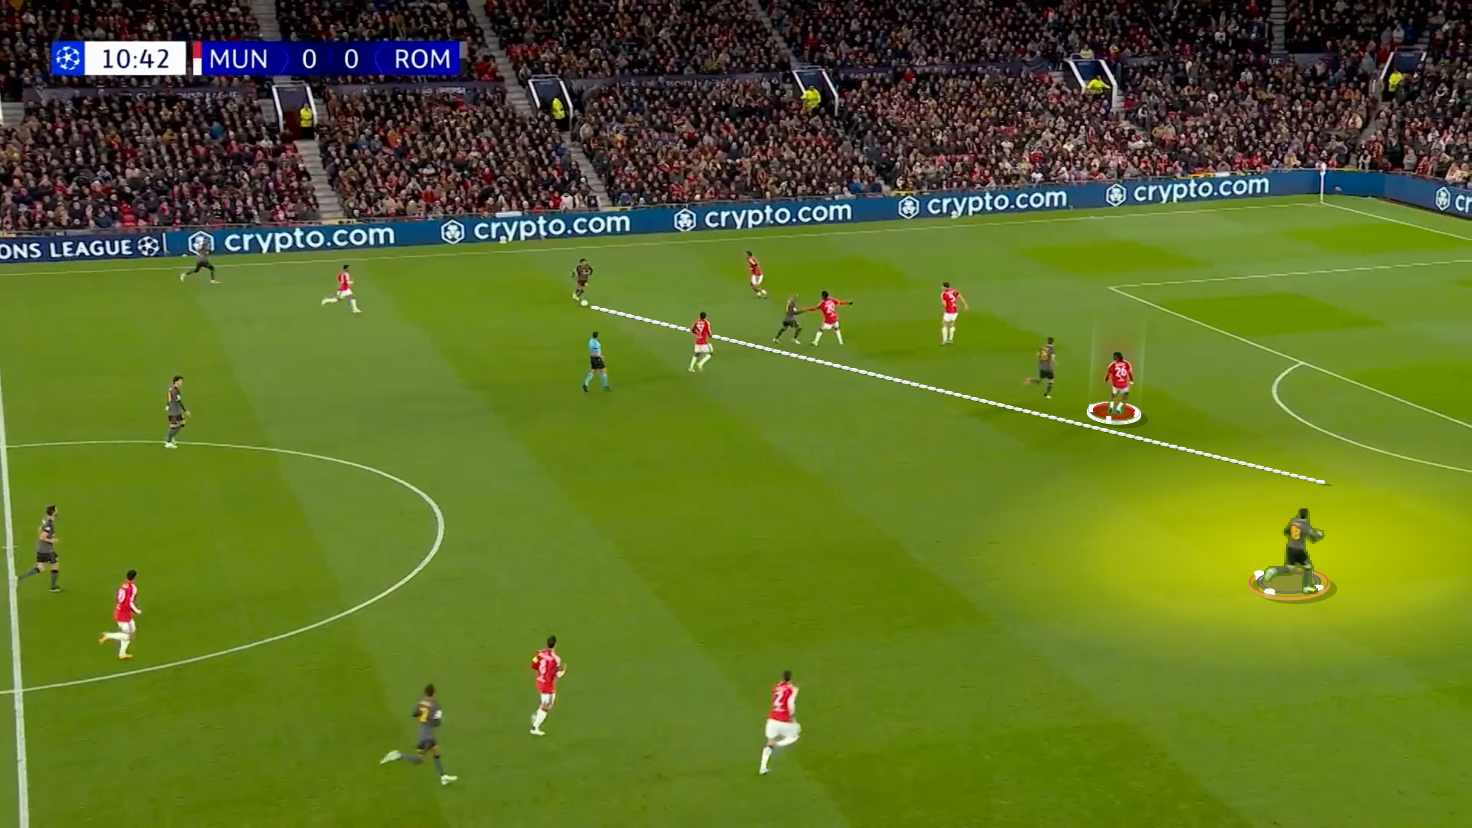
For example, in AS Roma's opening goal, with Rodrigo Mora on the ball on Roma's left, Ayden Heaven tucks too far inside, leaving acres of space in the opposite half-space.
Matías Soulé is completely free to run into it, and Mora plays a diagonal ball for Soulé to finish.
Ayden Heaven Leaves Matías Soulé Free In The Far-Side Half-Space
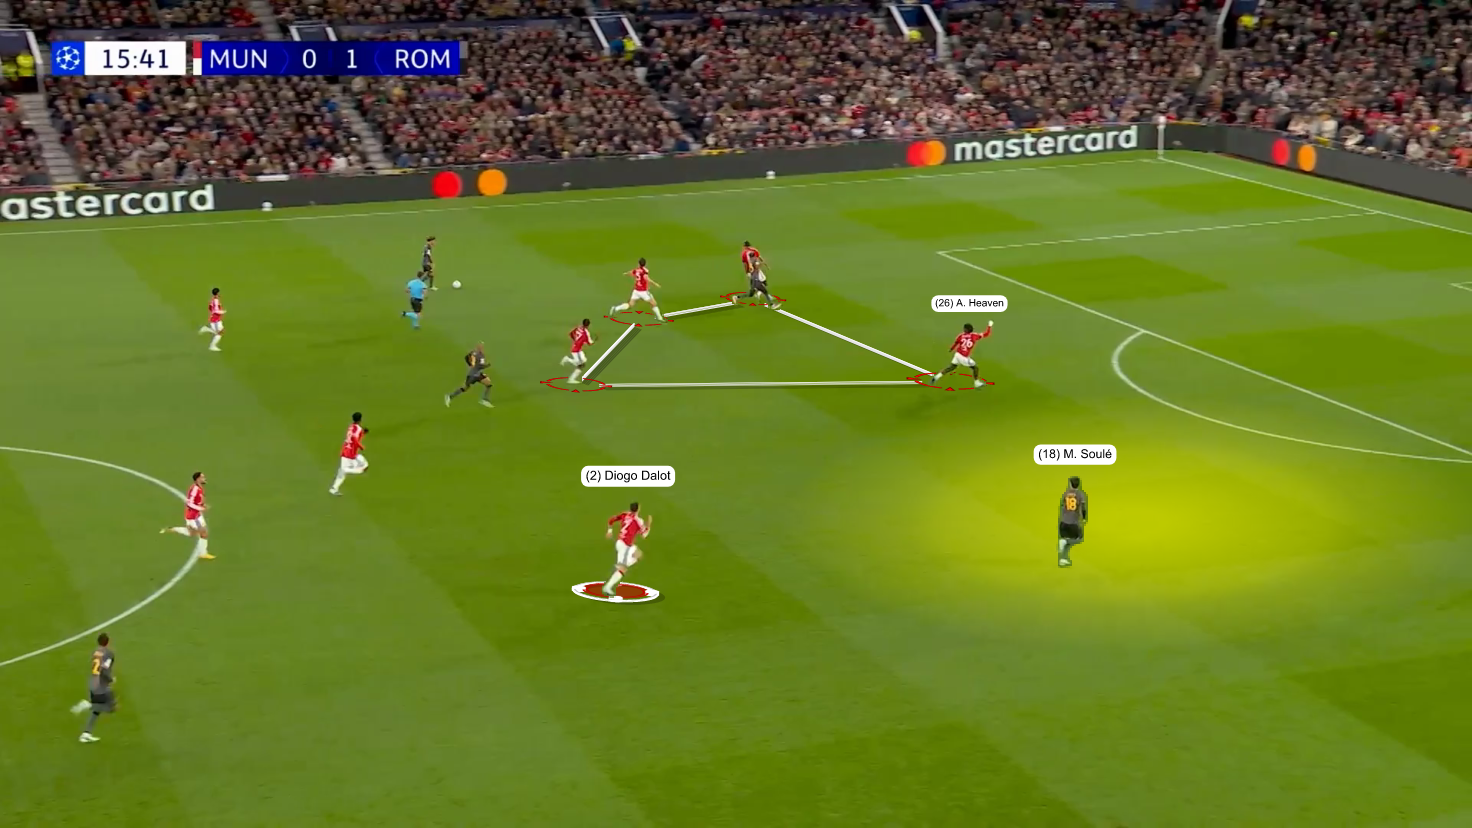
Just five minutes later, the same problem shows up again.
Heaven is once more standing too narrow, while Diogo Dalot is too late to deal with Soulé's movement into the space behind him; Soulé gets into the box and earns a penalty.
Ayden Heaven Narrow Position Leaves Another Gap For Matías Soulé To Attack
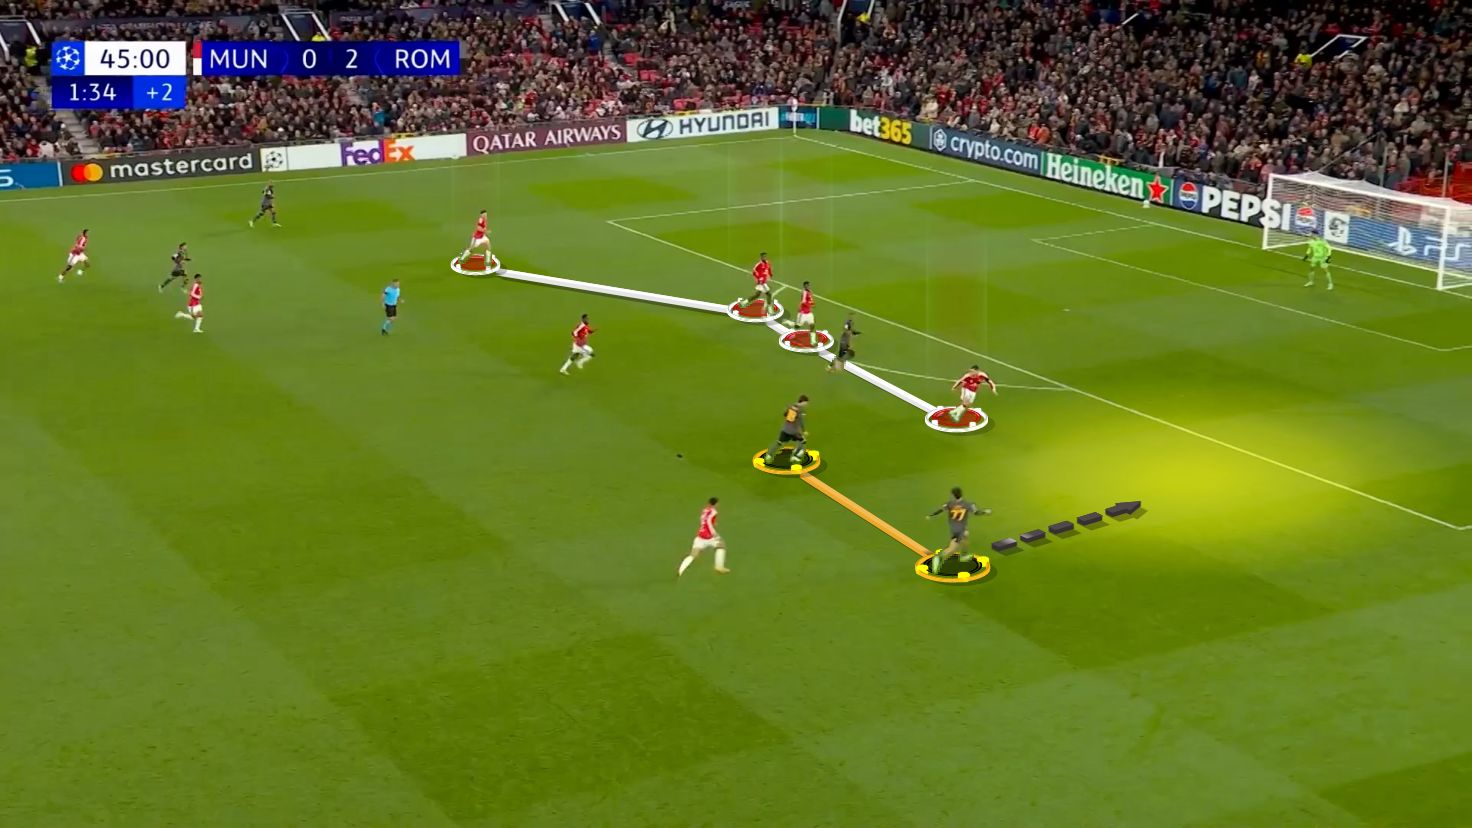
It happens again right before half-time.
This time, both Soulé and Emanuele Lulli, who came on for Devyne Rensch in the 21st minute, double up on Dalot, leaving him on his own against two players.
Matías Soulé & Emanuele Lulli Double Up On Diogo Dalot In The Right Half-Space Before The Half-Time
The same thing happened against Aston Villa.